A Forex Trader's View Of The Aussie/Gold Relationship

by Richard Lee

The relationships between different financial markets are almost as old as the markets themselves. For example, in many cases when benchmark equities rise, bonds fall. Many traders will watch for correlations like this and try to capitalize on the opportunity. The same types of relationships exist in the global foreign exchange market. Take for instance the closely related tie between the Australian dollar and gold. Due mostly to the fact that Australia remains a major producer of the yellow metal, the correlation is an opportunity that not only exists, but is one that traders on every level can capitalize on. Let's take a look at why this relationship exists, and how you can use it to produce solid gold returns.

Being Productive Is Key
The U.S. dollar/crude oil relationship exists for one simple reason: the commodity is priced in dollars. However, the same cannot be said about the Aussie correlation. The gold/Australian dollar relationship stems from production. As of 2008, Australia was ranked as the fourth-largest gold producer in the world, coming in behind China, South Africa and the United States. Even though it may not be the largest producer, the "Land Down Under" produces an estimated 225 metric tons of gold per year, according to the consultancy firm GFMS. As a result, it is only natural that the underlying currency of a major commodity producer follows a similar pattern to that commodity. With the ebb and flow of production, the exchange rate will follow supply and demand as money exchanges hands between miner and manufacturer. (For related reading, see Commodity Prices And Currency Movements.)

According to a 2005 GFMS survey, the last time Australia was ranked second in production behind South Africa, gold production in the South Pacific economy was at a height of approximately 263 tons per year. This volume made up a commanding 10.4% of the market. However, steadily but surely, production has been decreasing year over year (YOY), helping to drive prices higher. Ultimately, the shorter supply of gold has helped to create demand for the Australian dollar, which moved in lockstep with the commodity until mid-2008. If an investor or trader had taken advantage of this simple correlation, he or she would have earned an approximate 30% rate of return on the currency price alone (aside from any rollover interest associated with the trade). (For more, see Using Currency Correlations To Your Advantage.)

Capitalizing on the Relationship
Although the macro strategy does work on all levels, it is best suited for portfolios that are set in longer time frames. Traders are not going to see strong correlations on every single day of trading, much like other broader market dynamics. As a result, it's advantageous to cushion the blow of daily volatility and risk through a longer time horizon.

Fundamentally oriented traders will tend to trade one or both instruments, taking trading cues from the other. These cues can be gathered from a list of topics including:
  1. Commodity Reserve Reports
  2. COT Futures Reports
  3. Australian Economic Developments
  4. Interest Rates
  5. Safe Haven Investing
As a result, these trades tend to be longer than day-trade considerations as the portfolio is looking to capture the overall market tone rather than just an intraday pop or drop.

Technically, traders tend to find their cues in technical formations with the hope that corresponding correlations will seep into the related market. Whether the formation is in the gold chart or the Aussie chart, it is better to find one solid formation first, rather than looking for both charts to correlate perfectly. An example of this is clearly seen in the chart examples below.
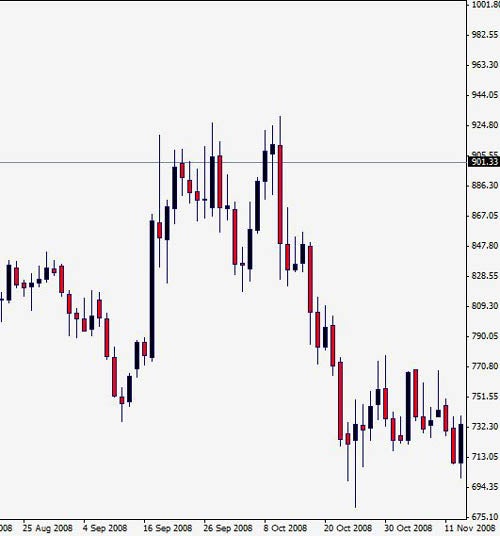
Figure 1
Source: FX Trek Intellicharts
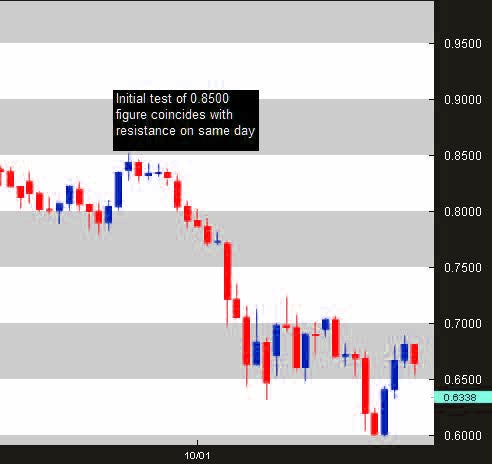
Figure 2
Source: MetaTrader

As shown in Figure 2, with the market in turmoil and investor deleveraging that was "en vogue" in 2008, traders saw an opportunity to jump on the bandwagon as both Aussie and gold experienced a temporary uptick in price. Already knowing that this would be a blow-off top in an otherwise bearish market, the savvy technical investor could visibly see both assets moving in sync. As a result, technically speaking, a short opportunity shone through as the commodity approached the $905.50 figure, which corresponded with the pivotal 0.8500 figure in the FX market. The double top in gold all but ensured further depression in the Australian dollar/U.S. dollar currency pair. (For more insight, see The Midas Touch For Gold Investors.)


Trying It Out: a Trade Setup
Now let's take a look at a shorter trade setup involving both the Australian dollar and gold.

First, the broad macro picture. Taking a look at Figure 2, we see that gold has taken a hard dive down as investors and traders have deleveraged and sold off riskier assets. Following this move, subsequent consolidation lends to the belief that a turnaround may be lingering in the market. The idea is supported by the likelihood that equity investors will elect to move some money into the safe haven characteristic of the commodity as global benchmark indexes continue to decline in value. (To read more about gold's reputation as a safe haven, see 8 Reasons To Own Gold.)
Figure 3
Source: MetaTrader

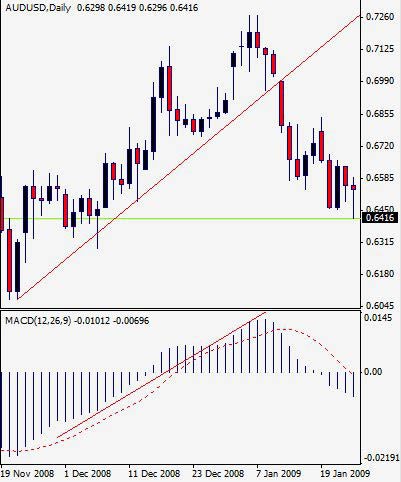
We see a similar position developing in the Australian dollar following a spike down to just below the 0.6045 figure, shown in Figure 4 below. At this time, the currency was under extreme pressure as global speculators deemed the Australian dollar a risky currency. Putting these two factors together, portfolio direction is looking to be upward.

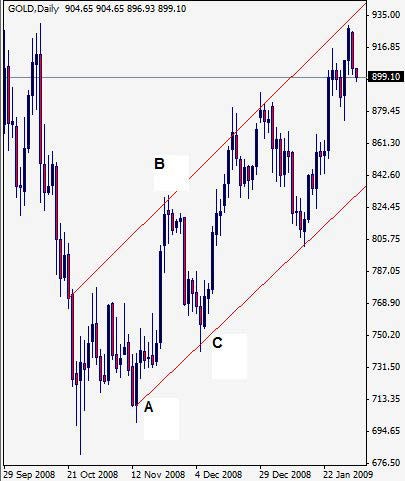
Next, we take a look at our charts and apply basic support and resistance techniques. Following our initial trade idea with gold, we first project a textbook channel to our chart as price action has displayed three defining technical points (labeled A, B and C). The gold channel corresponds with a short-term channel developing in the AUD/USD currency pair in Figure 4.

Figure 4
Source: MetaTrader

The combination culminates on December 10, 2008 (Figure 3 Point C). Not only do both assets test the support or lower channel trendline, but we also have a bullish MACD convergence confirming the move higher in the AUD/USD currency pair.

Finally, we place the corresponding entry at the close of the session, 0.6561. The subsequent stop would be placed at the swing low. In this case, that would be the December 5 low of 0.6290, a roughly 271 pip stop. Taking proper risk/reward management into account, we place our target at 0.7103 to give us a 2:1 risk-to-reward ratio. Luckily, the trade takes no longer than a week as the target is triggered on December 18 for a 542 pip profit.

Conclusion
Intermarket strategies like the Australian dollar and gold present ample opportunities for the savvy investor and trader. Whether it's to produce a higher profit/loss ratio or increase overall portfolio returns, market correlations are sure to add value to a market participant's repertoire.

by Richard Lee,

Richard Lee is a currency strategist for Online Forex Trading. Employing both fundamental and technical models, Lee has previously been featured on DailyFX.com, Bloomberg, FX Street.com, Yahoo Finance and Trading Markets.com. In analyzing the markets, he draws from an extensive experience trading fixed income and spot currency markets in addition to previous bouts in options, futures and equities.

Read more...

Forex Minis Shrink Risk Exposure

by Selwyn Gishen


Trading currencies means buying one country's currency while simultaneously selling another country's currency. Every currency trade therefore involves two currencies. The usual size of a currency pair is 100,000 units, known as a "standard lot."

In most cases, beginner traders do not want to stomach the risk that comes with the exposure of a standard lot. As a result, most online forex brokers offer the ability to trade mini lots, which are 10,000 units of the currency rather than 100,000. For a new trader, these mini lots can be an especially effective tool for learning to trade forex. (For background reading, see Getting Started In Forex.)

What is a Pip?
Before one can fully understand the benefits of a mini lot, it is important to review the concept of a pip. A pip is the smallest increment that a currency pair can move. For most currency pairs, a pip is a change in the fourth decimal place of the currency quote. For example, if EUR/USD is quoted at 1.5567 and it moves to 1.5568, it has increased by 1 pip. The value of 1 pip is calculated by the size of the lot that is traded. So, if you buy a standard lot of 100,000 EUR/USD at 1.5567 and it goes to 1.5568, a 1-pip move, then the value of your trade has increased by $10 (or 100,000 x 0.0001). (For more on this, see What is the value of one pip and why are they different between currency pairs?)

If we did the exact same calculation using a mini lot, then we would multiply the 1 pip by the size of a 10,000 mini lot instead of the usual 100,000 lot. So 10,000 x 0.0001 = $1. When you trade a standard lot, the value of the pip is $10, but when trading a mini lot the value of a pip is $1. This is true when the U.S. dollar is the second, or quoted, currency in the pair. (For more, see Common Questions About Currency Trading.)

Base Currency Vs. Quote Currency
One other piece of information to remember is that a currency pair is comprised of a base currency, which is the first currency listed in the pair, and the quote currency, which is the second currency listed in the pair. In the case of the EUR/USD, the euro is the base currency and the dollar is the quote currency.

The profit or loss is always expressed in terms of the quote currency. If the currency pair is the GBP/USD, then the base currency is the British pound and the quote currency is the U.S. dollar. For the USD/CAD, the base currency is the U.S. dollar and the quote currency is the Canadian dollar. Why the dollar is listed first in some instances but second in others is just a matter of convention. (For more insight, see the Forex Tutorial: Reading a Quote and Understanding The Jargon.)

The Value of a Pip
The last important point that should be noted before we talk about mini lots specifically is the value of a pip. Suppose you are trading the GBP/JPY; the British pound is the base currency and the Japanese yen is the quote currency. Now in this instance, we have an exception to the fourth decimal place rule for the size of a pip. In the case of the yen, 1 pip is measured in the second decimal place. The yen is the only exception. To calculate the value of the move, if we buy dollars against the yen and the dollar goes up from 103.45 to 103.46, then we have a 1-pip move. Multiplying by the standard lot of 100,000 x 0.01 = 1,000 yen. To bring this back to dollars, you would then divide the 1,000 yen by the dollar rate, let's say it's 103.46, which equals $9.66.

Why Trade Minis?
The real value of trading minis is in the versatility it provides in matching the trade size to an acceptable level of risk. For example, suppose you decide to take a long position in the USD/JPY. Let's assume that your entry point is 103.55 and that you've set your stop-loss order 15 pips away at 103.40. If you have $1,000 in your trading account, the maximum risk you should take in any trade is 3% of your trading capital. Because your capital is $1,000, 3% of your capital is $30. If you are stopped out of this trade and you are trading a mini lot, you will lose $15. But if you are prepared to risk $30, you can actually trade two mini lots and get the power and benefit of some leverage. If you were only trading standard lots, this trade would not be possible because a 15-pip loss, as per this example, would be $150, which is 15% of your $1,000 trading capital. Given a risk tolerance of 3% of the portfolio, this is too much risk for one trade. (For related reading, see Forex Leverage: A Double-Edged Sword.)

Mini lots allow a trader to adjust the amount of effective leverage used in each trade. With mini contracts, you can trade the equivalent of one standard lot by simply trading 10 minis. If you only want to trade a half of a standard lot, you can do so by buying five mini lots.

The Bottom Line
Mini lots provide flexibility that standard lots cannot offer. A mini lot is simply 10% of a standard lot and therefore, by trading in minis you can trade in fractions of a standard lot, anywhere from 1 mini to 10 minis. Mini lots are useful if the natural stop loss for your trade is farther away than the maximum risk you feel comfortable taking. You can simply reduce the risk by decreasing the number of minis until that number would equate to the stop-loss risk. Of course, if your market maker offers you 100:1 leverage, then for an account of $1,000, you can trade up to 10 minis at a time. The number of minis traded should be governed by how much you can lose if your trade goes wrong, which should not exceed 2-3% per trade.

by Selwyn Gishen,

Selwyn Gishen is a trader with more than 15 years of experience trading forex and equities for a private equity fund. For the past 35 years, he has also been a student of metaphysics, and has written a book called "Mind: How Changing Your Mind Can Change Your Life!" (2007). Gishen is the founder of FXNewsandViews.Com and the author of a forex trading guide entitled "Trading the Forex Markets: A Foundation Course for Online Traders". The course is designed to provide the trader with all the aspects of Gishen's Fusion Trading Model.

Read more...

Uncover Forex Profits With The Turn Trade

by Kathy Lien and Boris Schlossberg


Most traders have an extremely hard time trading with the trend. This observation may seem counterintuitive, as the majority of traders claim that trend trading is their preferred approach to the market. However, after analyzing the records of thousands of retail traders, we are convinced the opposite is true. While everyone pays lip service to the idiom of "The trend is your friend", in reality, most traders love to pick tops and bottoms and constantly fade rather than trade with the trend. In this article, we'll cover the turn trade, a setup which allows traders to have their cake and eat it too: buying low and selling high while still trading with the trend. (For related reading, see Inside Day Bollinger Band Turn Trade.)

Turn Trade Basics
The turn trade recognizes the desire of most traders to find turns in the price action (that is to buy low and sell high), but it does so in the overarching framework of trading with the trend. The setup uses multiple time frames, moving averages and Bollinger band "bands" as its tools of entry. (For background reading, see The Basics Of Bollinger Bands.)

Getting Started
We begin by looking at the daily charts to ascertain whether a pair is in a trend, and used a 20-period daily simple moving average to determine the trend. In technical analysis, there are a number tools that can help us diagnose trend, but none is as simple and effective as the 20-period SMA. It includes a full month's worth of data (20 business days) and, as such, it provides us with a very good idea of an average price. Therefore, if price action is above the "average" price, we assume the pair is in an uptrend and vice versa.

Next, we move to the hourly charts to pinpoint our entries. In the turn to trend setup we will only trade in the direction of the trend by buying highly oversold prices in an uptrend and selling highly overbought prices in a downtrend. How will we determine our overbought and oversold extremes? The answer is by using Bollinger band "bands" to help us gauge the price action. Bollinger bands measure price extremes by calculating the standard deviation of price from its 20-period moving average. In the case of hourly charts, we will use Bollinger bands with three standard deviations (3SD) and Bollinger bands with two standard deviations (2SD) to create a set of Bollinger band channels. When price trades in a trend channel, most of the price action will be contained within the Bollinger band "bands" of 2SD and 1SD.

Why do we use the 3SD and 2SD settings in this particular setup? Because the Bollinger band rule applies to price action on the daily scale. In order to properly trade the hourly charts, which are more short term and therefore more volatile, we need to accommodate to those extremes in order to generate the most accurate signals possible. In fact, a good rule of thumb to remember is that traders should increase their Bollinger band values with every decrease in time frame. So, for example, with five-minute charts, traders may want to use Bollinger bands with setting of 3.5SD or even 4SD to focus on only the most oversold or overbought conditions.

Moving back to our setup, after having established the direction of the trend, we now observe the price action on the hourly charts. If price is in an uptrend on the dailies, we watch the hourlies for a turn back to the trend. If price continues to trade between the 3SD and the 2SD lower Bollinger band "bands", we stay away, as it indicates a strong downward momentum.

The beauty of this setup is that it prevents us from guessing the turn prematurely by forcing us to wait until the price action confirms a swing bottom or a swing top. In our example, if the price trades above the 2SD lower Bollinger band on the closing basis, we enter at market using the prior swing low minus five points as the stop. We set our target for the first unit at half the amount of risk; if it is hit, we move the stop to breakeven for the rest of the position. We then look for the second unit to trade up to the upper Bollinger band and exit the position only if the pair closes out of the 3SD-2SD Bollinger band channel, suggesting that the uptrend move is over.

Rules for the Long Trade
  1. On the daily setup, place a 20-period SMA and make sure that the price is above the moving average on a closing basis.
  2. Take only long trades in the direction of the trend.
  3. Move to the hourly charts and place two sets of Bollinger bands on the chart. The first pair of Bollinger bands should be set to 3SD and the second pair should be set to 2SD.
  4. Once the price breaks through and closes above the lower 3SD-2SD Bollinger band channel on an hourly basis, buy at market.
  5. Set stop at swing low minus five points and calculate your risk (Risk = Entry Price - Stop Price). (Traders who want to give the setup a little more room can use swing low minus 10 points as their stop.)
  6. Set a profit target for the first unit at 50% of risk (i.e., if you are risking 40 points on the trade then place a take-profit limit order 20 points above entry.)
  7. Move the stop to breakeven when the first profit target is hit.
  8. Exit the second unit when the price closes below the upper 3SD-2SD Bollinger band channel or at breakeven, whichever comes first.
Rules for the Short Trade
  1. On the daily setup, place a 20-period SMA and make sure that the price is below the moving average on the closing basis.
  2. Take only short trades in the direction of the trend.
  3. Move to the hourly charts and place two sets of Bollinger bands on the chart. The first pair of Bollinger bands should be set to 3SD and the second pair should be set to 2SD.
  4. Once price breaks through and closes above the upper 3SD-2SD Bollinger band channel on an hourly basis, sell at market.
  5. Set a stop at swing low plus five points and calculate your risk (Risk = Entry Price - Stop Price). (traders who want to give the setup a little more room can use swing high plus 10 points as their stop.)
  6. Set profit target for the first unit at 50% of risk (i.e., if you are risking 40 points on the trade, then place a take-profit limit order 20 points above entry).
  7. Move stop to breakeven when the first profit target is hit.
  8. Exit the second unit when price closes above the lower 3SD-2SD Bollinger band channel or at breakeven, whichever comes first.
The Turn Trade In Action
Now let's look at some examples:
Figure 1: Turn to the Trend, EUR/CHF
Source: FXtrek Intellichart

Taking a look at the EUR/CHF daily chart in Figure 1, we see that since the middle of March 2006, EUR/CHF has traded above its 20-day SMA, indicating that it is in a clear uptrend.

Figure 2: Turn to the Trend, EUR/CHF
Source: FXtrek Intellichart

Turning to the hourlies, we wait until the pair breaks out of the lower Bollinger band 3SD-2SD zone to go long at market at 6pm EST on March 15, 2006, at 1.5635 with a stop at 1.5623, risking only 12 points. (Note that EUR/CHF tends to be a very low volatility currency pair providing us with very small risk setups. Because the risk is so small, we may choose to set our target at 100% of risk rather than the usual 50% of risk.)

Regardless of our choice, we are able to take profits at 3am EST on March 16, 2006, at 1.5651, banking 16 points on the first unit. We then move our stop to breakeven on the rest of the position and target the upper Bollinger band. We wait for the price to pierce the upper Bollinger band, trade within it; only when it falls out of the upper Bollinger 3SD-2SD band channel do we exit the rest of the position at 1pm EST on March 16, 2006, at 1.5692, earning 57 points on the second lot. Not bad for a trade on which we risked only 12 points.

Figure 3: Turn to the Trend, USD/CAD
Source: FXtrek Intellichart

The example of USD/CAD shown in Figure 3 and Figure 4 shows a classic turn to trend setup after it establishes an uptrend on March 7, 2006.

Figure 4: Turn to the Trend, USD/CAD
Source: FXtrek Intellichart

We move from the dailies to the hourly charts and wait until the prices recover above the lower Bollinger band, entering a long at market at 11am EST on March 16, 2006, at 1.1524. We place our stop at 1.1505, which is the swing low minus five pips for a miniscule 19-point risk.

At 10pm EST on March 16, 2006, as price makes a burst upward, we sell half the position at 1.1540 and move our stop to breakeven, locking in 16 points of profit. After the price makes another burst higher, we exit at the first hint of weakness, when the hourly candle closes below the 3SD-2SD Bollinger band zone. This occurs at 11am on March 17, 2006, and we close out the rest of our position at 1.1587, for a 63-point profit on the second half of the trade.

Figure 5: Turn to the Trend, GBP/USD
Source: FXtrek Intellichart

The example in Figure 5 shows a short trade. On February 15, 2006, we look at the daily chart and see that the GBP/USD is trading below its 20-day SMA, which indicates that it is in a clear downtrend.

In Figure 6, we turn our attention to the hourly chart and try to enter a high probability short when the price becomes overbought on a shorter-term time frame. We do this by waiting for the GBP/USD to close below the 3SD-2SD upper Bollinger band channel, at which time we sell at market (1.7440) and place our stop at approximately 1.7500, risking 60 points. As per our rules, we cover half the position at 1pm EST when price approaches the 1.7410 level, which is 30 points, or 50% of our risk.

Next, we move our stop at breakeven and hold the position, targeting the lower 3SD Bollinger band. Notice that the downtrend re-establishes itself with a vengeance and the price declines into our zone. We stay in the trade until the price breaks back out of the lower Bollinger band channel, indicating that downward momentum is waning. At 6am on February 16, 2006, we cover the rest of the trade at 1.7338, for a profit of 102 points.

Figure 6: Turn to the Trend, GBP/USD
Source: FXtrek Intellichart

Figure 7 shows another good example of why we always scale out of our positions. On March 15, 2006 USD/CHF is in a downtrend, but the pair begins to trade back up to the 20-period SMA on the dailies. Because we can never be certain beforehand whether this is a retrace or a real turn in the trend, we adhere to the rules of the setup to control our risk.

Figure 7: Turn to the Trend, USD/CHF
Source: FXtrek Intellichart

Looking on the hourly charts in Figure 8, we see that at 1pm EST on March 21, 2006, the price closes below the upper Bollinger band 3SD-2SD level, and we enter a short at market at 1.3021. Our stop is placed five points above the swing high at 1.3042, for total risk of 21 points.

At 6pm EST on March 21, 2006, the price reaches our first target of 1.3008, and we cover one lot for 12 points of profit or approximately 50% of risk. We simultaneously move our stop to breakeven. At this point, the trade begins to move against us, but our breakeven stop insures that we do not lose any money and, in fact, still bank 12 points of profit on the first half of the position.

Figure 8: Turn to the Trend, USD/CHF
Source: FXtrek Intellichart

When The Setup Fails
Finally, let's take a look at an example of a failed setup in Figure 9. Starting on March 3, 2006, the EUR/GBP breaks above the 20-period SMA and establishes an uptrend on the daily charts.

Figure 9: Turn to the Trend, EUR/GBP
Source: FXtrek Intellichart

Using our turn to trend approach, we wait for the pair to make a swing low in the 3SD-2SD Bollinger band zone and then enter long at .6881 at 10am EST on March 14, 2006. The swing low was created at 7am EST that same day at .6878, so we place our stop at .6873, five points below the swing low, risking a total of eight points. Note that the EUR/GBP pair is a very slow-moving cross with very high pip values. A point in the EUR/GBP is worth approximately 175% of a point in EUR/USD, so an eight-point risk in EUR/GBP would translate into a 14-point risk in EUR/USD.

Figure 10: Turn to the Trend, EUR/GBP
Source: FXtrek Intellichart

Initially, the price makes a small rally but then drops to .6873 at noon EST on March 14, 2006, taking out our stop. This turns out to be the exact low of the move, and many traders may find it incredibly frustrating to be taken out of a trade just before it has a chance to turn around and generate profits. Not us, however. We realize that getting stopped on a bottom tick is just a part of trading and will probably happen more times than we care to remember. Far more important is to appreciate the risk management aspect of the trade, which leaves us only with a slight loss of eight points, thus preserving our capital and allowing us to look for other high probability setups.

To truly appreciate the importance of this dynamic, just imagine the following scenario. Instead of a stop loss, we leave the trade open and instead of turning around, it proceeds to drop even further. Before long, we may be looking at a floating loss in hundreds of points - something that would be inordinately more difficult to make up than our initial small eight-point stop.

Conclusion
Most traders love to pick tops and bottoms, rather than trade with the trend. The turn trade allows you to do both by using multiple time frames, moving averages and Bollinger band "bands" as its tools of entry.

Read more...

The Forex Three-Session System

by John Kicklighter

One of the greatest features of the foreign exchange market is that it is open 24 hours a day. This allows investors from around the world to trade during normal business hours, after work or even in the middle of the night. However, not all times are created equal. Although there is always a market for this most liquid of asset classes, there are times when price action is consistently volatile and periods when it is muted. What's more, different currency pairs exhibit varying activity over certain times of the trading day due to the general demographic of those market participants that are online at the time. In this article, we will cover the major trading sessions, explore what kind of market activity can be expected over the different periods and show how this knowledge can be adapted into a trading plan.

Breaking A 24-Hour Market Into Manageable Trading Sessions
While a 24-hour market offers a considerable advantage for many institutional and individual traders because it guarantees liquidity and the opportunity to trade at any conceivable time, it also has its drawbacks. Although currencies can be traded any time, a trader can only monitor a position for so long. This means that there will be times of missed opportunities, or worse, when a jump in volatility will lead the spot to move against an established position when the trader isn't around. To minimize this risk, a trader needs to be aware of when the market is typically volatile and decide what times are best for his or her strategy and trading style. (For more, see Trade To Your Taste.)

Traditionally, the market is separated into three sessions during which activity peaks: the Asian; European; and North American sessions. More casually, these three periods are also referred to as the Tokyo, London and New York sessions. These names are used interchangeably as the three cities represent the major financial centers for each of the regions. The markets are most active when these three powerhouses are conducting business as most banks and corporations make their day-to-day transactions and there is a greater concentration of speculators online. Now let's take a closer look at each of these sessions. (For more, see how does the foreign-exchange market trade 24 hours a day?)

Asian Session (Tokyo)
When liquidity is restored to the forex (or, FX) market after the weekend passes, the Asian markets are naturally the first to see action. Unofficially, activity from this part of the world is represented by the Tokyo capital markets, which are live from midnight to 6am Greenwich Mean Time. However, there are many other countries with considerable pull that are present during this period including China, Australia, New Zealand and Russia, among others. Considering how scattered these markets are, it stands to reason that the beginning and end of the Asian session are stretched beyond the standard Tokyo hours. Allowing for these different markets' activity, Asian hours are often considered to run between 11pm and 8am GMT.


European Session (London)
Later in the trading day, just before the Asian trading hours come to a close, the European session takes over in keeping the currency market active. This FX time zone is very dense and includes a number of major financial markets that could stand in as the symbolic capital. However, London ultimately takes the honors in defining the parameters for the European session. Official business hours in London run between 7:30am and 3:30pm GMT. Once again though, this trading period is expanded due to other capital markets' presence (including Germany and France) before the official open in the U.K.; while the end of the session is pushed back as volatility holds until the London fix after the close. Therefore, European hours are typically seen as running from 7am to 4pm GMT.

North American Session (New York)
By the time the North American session comes on line, the Asian markets have already been closed for a number of hours, but the day is only half through for European traders. The Western session is dominated by activity in the U.S. with few contributions from Canada, Mexico and a number of countries in South America. As such, it comes as little surprise that activity in New York City marks the high in volatility and participation for the session. Taking into account the early activity in financial futures, commodity trading and the concentration of economic releases the North American hours unofficially begin at noon GMT. With a considerable gap between the close of the U.S. markets and open of the Asian trading, a lull in liquidity sets the close of New York exchange trading at 8pm GMT as the North American session close.

Session Major Market Hours (GMT)
Asian Session Tokyo 11pm to 8am
European Session London 7am to 4pm
North American Session New York noon to 10pm
Figure 1: Major market session hours

Figure 2: Three-market session overlap
Copyright Ó 2008 Investopedia.com

Measuring Market Activity
Now that we know when the Asian, European and North American sessions are and what markets comprise each, we should discuss how time and participation affect price action for different currencies.

As logic would suggest, a currency is typically most active when its own markets are open. For example, the euro, British pound and Swiss franc see higher volatility on average when the European session is active. This is the case because banks, businesses and traders from any specific country will use their domestic currency in the majority of their foreign exchange transactions. What's more, it is more difficult for a market participant to buy or sell a currency from a region where all the major banks are closed. To illustrate, if a U.S. bank wants to make a multibillion dollar currency exchange for euros, it would likely do so when European banks are online and there is a greater pool of liquidity. Otherwise, large orders in a thin market would result in prices moving away from the ideal entry point as the order is processed.


The above example further highlights another truism for the currency markets: price action is usually greatest when the sessions overlap. When traders, banks and business from two different sessions are online, there are more participants in the market and, therefore, a greater level of liquidity is available. Figure 3 below charts the average hourly range for the seven majors in the two years through 2007. A quick glance at this graph reveals what we would expect - two notable peaks in price action. The first rise in price action occurs around the closing hours of the Asian session and open of the European session (around 7am GMT). Before this peak, the markets in the Far East are carrying currency volatility alone. After the Japanese session closes, there is a clear drop in the ranges for most of the majors as Asian liquidity quickly evaporates and leaves traders in Europe to keep the fires of volatility stoked. (For more, see Getting Started In Forex.)

The second and larger jump in activity is seen when the North American and European sessions converge (between noon and 4pm GMT). This four-hour overlap is far greater than the Asian/European sessions' own union, and volatility clearly benefits from the greater period of liquidity. However, from this period we can see there is another factor at work in driving price action - otherwise there would not be a consistent dip across the majors at 1pm GMT. This particular influence is the presence of fundamental releases. Most of the top market moving indicators for the U.S. cross the wires at either noon or 2pm GMT and thereby boost the average range for those times. And, while the influence of the U.S. data is the clearest example here, fundamentals from other key markets certainly influence price action as well. Another obvious instance of this dynamic is the typical release time for U.K. data (around 8am GMT), which coincides with a sharp peak in GBP/USD activity that goes beyond the Asian/European session overlap and cooling of the other major pairs.

Figure 3: Currency market volatility
Copyright Ó 2008 Investopedia.com

Another aspect to take into consideration is that while broad market activity typically follows the same trend as seen across the majors (a peak in volatility during the two session overlaps), each pair is unique depending on its two component currencies and which underlying sessions they belong to. For example, when a pair is made up of two currencies from the same session (let's say USD/CAD), there will likely be a relatively greater level of volatility during that session (the U.S. session) while price action is subsequently more muted during the market's other high points (the Asian/European session overlap).

In contrast, if the pair is a cross made of currencies that are most actively traded during Asian and European hours (like EUR/JPY and GBP/JPY), there will be a greater response to the Asian/European session overlaps and a less dramatic increase in price action during the European/U.S. sessions' concurrence. Of course, the presence of scheduled event risk for each currency will still have a substantial influence on activity regardless of the pair or its components' respective sessions.


Figure 4: A greater response to Asian/European session overlaps is shown in pairs that are actively traded during Asian and European hours.
Copyright Ó 2008 Investopedia.com

How To Weave This Into a Trading Strategy
There are few things more important to successful trading than market activity. Even the best strategy could fall apart if it is applied during the wrong session. For long-term or fundamental traders, trying to establish a position during a pair's most active hours could lead to a poor entry price, a missed entry or a trade that counters the strategy's rules. On the other hand, for short-term traders who do not hold a position over night, volatility is vital. (For more, see The Fundamentals Of Forex Fundamentals.)

Conclusion
When trading currencies, a market participant must first determine whether high or low volatility will work best with their personality and trading style. If more substantial price action is desired, trading the session overlaps or typical economic release times may be the preferable option. The next step would be to decide what times are best to trade given the bias for volatility. Following with a desire for high volatility, a trader will then need to determine what time frames are most active for the pair he or she is looking to trade.

When considering the EUR/USD pair, the European/U.S. session crossover will find the most movement. However, there are usually alternatives, and a trader should balance the need for favorable market conditions with physical well-being. If a market participant from the U.S. prefers to trade the active hours for GBP/JPY, he or she will have to wake up very early in the morning to keep up with the market. If this person has a regular day job, this could lead to exhaustion and errors in judgment when trading. A better alternative for this particular trader may be trading during the European/U.S. session overlap, where volatility is still elevated even though Japanese markets are offline.


by John Kicklighter,

John Kicklighter is a currency analyst at the world's largest retail forex market maker, Forex Capital Markets LLC in New York. He writes a number of daily, weekly and ad hoc articles for DailyFX.com, FXCM's research branch, covering both fundamental and technical trends in the currency market. He also authors daily reports for FXCM clients highlighting potential range and event risk trades. John has been an active trader since the age of 17 and has traded stocks, financial futures, commodities, spot currency and options on all these instruments for his own account. John graduated with a bachelor's degree in finance and investment from Baruch College in New York.


Read more...

Trade Forex With A Directional Strategy

by David Gonzalez,CMT


Forex was once a marketplace available only to governments, central banks, commercial and investment banks and other institutional investors like hedge funds. Today, however, there are many venues where just about anyone can trade currencies. These include currency futures, options on futures, PHLX-listed foreign currency options and the largely unregulated over-the-counter (OTC) forex market. Once the forex trader has decided which venue(s) and instrument(s) he or she will trade, it's time to develop a well-conceived trading strategy before putting any trading capital at risk. Successful traders must also predetermine their exit strategies and other risk-management tactics to be used should a trade go against them. Here we look at how to develop a trading strategy for the currency markets based on directional trading.(To review some of the concepts in this piece, check out Basic Concepts For The Forex Market and Common Questions About Currency Trading.)

Develop a Trading Strategy
One way to organize the multitude of potential strategies is to group them into directional and non-directional approaches. Directional trading strategies take net long or short positions in a market, as opposed to nondirectional (market-neutral) strategies. Most investors are familiar with the directional approach; for example, millions of people participate in some form of retirement program, which is basically a long-term portfolio of equity and/or debt securities held long by the investor. Net long strategies are profitable in rising markets, while net short investors should profit in falling markets. Directional strategies can be loosely grouped into the following subcategories:

This list is not all-inclusive, as there are many other approaches to trading forex. (For more, read Trading Double Tops And Double Bottoms and Identifying Trending & Range-Bound Currencies.)

Trend-Following Strategies
Trend-following systems create signals for traders to initiate positions once a specific price move has occurred. These systems are based on the technical premise that once a trend has been established, it is more likely to continue rather than reverse. (Read more about trends in the forex market in Trading Trend Or Range?)

Moving-Average (MA) Crossover
The moving average (MA) crossover trading system is one of the most common directional systems in use today. This system uses two MAs. Buy signals are generated when the shorter-term, faster-moving MA crosses over the longer average. This indicates that the near-term price action is accelerating to the upside.

These systems are susceptible to false signals, or "whipsaws". As such, traders should experiment with different time periods and conduct other backtesting before trading.

Figure 1
Source: forex.tradingcharts.com


This crossover system posted a buy signal when the five-day crossed over the 20-day to the upside in March 2008, on the left side of the chart. The position is closed once either a downside crossover occurs (as posted in May, right side of chart), or the trade reaches a predetermined price objective.

Breakout Systems

Breakout systems are extremely easy to develop. They are basically a set of predefined trading rules based on the simple premise that a price move to a new high or low is an indication of a continuing trend. Therefore, the system triggers an action to open a position in the direction of the new high/low.

For example, a breakout system may state that the trader should close all shorts and open a long position if the day's closing price exceeds the high price for the past X days. Part two of the same breakout system will state that the trader must close longs and open a short position if the day's close is below the X day's low print. The secret is to determine how long of a period you'd like to trade. Shorter time periods (faster systems) will detect trending markets faster than slower systems. The drawback is that more whipsaws will occur with faster systems.


Pattern-Recognition Strategies
A thorough discussion of every pattern used by forex traders is obviously beyond the scope of this article. As such, we will look at a few popular continuation patterns used by traders. (For more on charts patterns, read Price Patterns - Part 1.)

Triangles
Triangles can signal trend reversals, but most often they are continuation patterns (meaning that the resolution of the triangle will result in the resumption of the prior trend). There are several different types of triangles, each possessing its own unique characteristics and forecasting implications.

Traders should open positions once the price action breaks out beyond the converging boundaries of the triangle. In this case, the trader will buy the British pound once the price breaks out above the upper boundary near 1.99.

One way to forecast the extent of the resulting move is to measure the distance of the triangle base and add that distance to the level where the breakout occurred (~.04 to ~.05 + 1.99 = 2.04)

Figure 2: Symmetrical pattern at the midpoint of a bullish move
Source: forex.tradingcharts.com


Flags
Flags are continuation or consolidation patterns that usually display a period of back and forth action sloped against the primary trend. Pennants have shown to be extremely reliable. They almost always consolidate the prevailing trend and very rarely signifying a trend reversal. As with triangles, traders should open positions upon a breach of the boundary. Like other continuation patterns, flags often occur near the midpoint of a primary move.

Figure 3: Textbook bullish flag, sloped against the direction of the primary trend
Source: forex.tradingcharts.com


Risk-Management Tactics
There are a number of ways traders can reduce risk and avoid the catastrophic losses that will wipe out trading capital. Traders can set arbitrary points at which they must exit losing positions. They can also place stop orders. Another popular way to trade is to design mechanical trading systems or so-called black-box systems that use an overriding preprogrammed logic to make all trading decisions.

There are several perceived benefits to using mechanical trading systems. One is that the core danger emotions of fear and greed are eliminated from the bulk of your trading. These systems help traders avoid common mistakes such as excessive trading and closing positions prematurely. Another benefit is consistency. All signals are followed because the market conditions required to trigger a signal are detected by the system. Mechanical systems naturally force traders to control losses, since a reversal will arbitrarily trigger a new signal, reversing or closing the open position. (Read more about the effects of excessive trading on your portfolio in Tips For Avoiding Excessive Trading.)

Mechanical systems are only as good as the input data and backtesting conducted before beginning the trading campaign. The simple reality is that there is no perfect way to simulate real market conditions. Eventually, the trader must enter the markets and put real money at risk. You can paper-trade and backtest all you want, but the true test is when you go live.

Parting Words
Traders must always review and evaluate the efficacy of their strategies. Market conditions are constantly changing, and traders must adapt their systems to whatever market conditions they find themselves in.

by David Gonzalez

David Gonzalez, CMT, is a Chartered Market Technician based in Orlando, Fla. He serves as the chapter chair for the Market Technicians Association's Florida Region.

Read more...

Forex Courses Teach Beginners How To Trade

by David Hunt

Investors looking to enter the world of foreign exchange can find themselves frustrated and quickly spiraling downward, losing capital rapidly and optimism even faster. Investing in forex - whether in futures, options or spot - offers great opportunity, but it is a vastly different atmosphere than the equities market. Even the most successful stock traders will fail miserably in forex by treating the markets similarly. Equity markets involve the transfer of ownership, while the currency market is run by pure speculation. But there are solutions to help investors get over the learning curve - trading courses. (Currency trading offers far more flexibility than other markets, but long-term success requires discipline in money management. Learn more in Forex: Money Management Matters.)

What's Out There?
When it comes to forex trading courses, there are two main categories:
  1. Online courses
  2. Individual training
Online courses can be compared to distance learning in a college-level class. An instructor provides PowerPoint presentations, ebooks, trading simulations and so on. A trader will move through the beginner, intermediate and advanced levels that most online courses offer. For a trader with limited foreign exchange knowledge, a course like this can be invaluable. These courses can range from $50 to well into the hundreds of dollars. (If you're a beginner, check out Common Questions About Currency Trading for an overview of basic concepts.)

Individual training is much more specific, and it is advised that a trader have basic forex training before entering. An assigned mentor, typically a successful trader, will go through strategy and risk management but spend the bulk of the time teaching through placing actual trades. Individual training runs between $1,000 and $10,000.

What to Look For
No matter which type of training a trader selects, there are several things he or she should examine prior to signing up:
  • Reputation of the course: A simple Google search shows roughly two million results for "forex trading courses". To narrow the search, focus on the courses that have solid reputations. There are many scams promising giant returns and instant money (more on this later). Don't believe the hype. A solid training program won't promise anything but useful information and proven strategies. (Read Getting Started In Forex for more on defining a strategy.)
A course's reputation is best gauged by talking with other traders and participating in online forums. The more information you can gather from people who have taken these courses, the more confident you can be that you will make the right choice.
However, each country has its own regulatory boards, and international courses may be certified by different organizations.
  • Time/cost: Trading courses can require a solid commitment (if individual mentoring is involved) or can be as flexible as online podcast classes (for internet-based learning). Before choosing a course, carefully examine the time and cost commitments, as they vary widely.
If you don't have several thousand dollars budgeted for one-on-one training, you are probably better off taking an online course. However, if you plan on quitting your job to trade full-time, it would be beneficial to seek professional advice - even at the higher cost. (Read Get Into A Broker Training Program for more information on becoming a broker.)

Staying Away From Scams
"Make 400% returns in a day!" . . . "Guaranteed profits!" . . . "No way to lose!"

These and other catchphrases litter the internet, promising the perfect trading course leading to success. While these sites may be tempting, beginning day traders should steer clear, because any guarantee in the world of foreign exchange is a scam. (Read more about day trading in Would You Profit As A Day Trader?)

According to the Commodity Futures Trading Commission (CFTC) in a May 2008 release, forex scams are on the rise:

"The CFTC has witnessed increasing numbers, and a growing complexity, of financial investment opportunities in recent years, including a sharp rise in foreign currency (forex) trading scams.

The Commodity Futures Modernization Act of 2000 (CFMA) made clear that the CFTC has jurisdiction and authority to investigate and take legal action to close down a wide assortment of unregulated firms offering or selling foreign currency futures and options contracts to the general public."

To ensure a trading course is not a scam, read its terms and conditions carefully, determine whether it promises anything unreasonable and double-check its certification for authenticity. (Find out how to protect yourself and your loved ones from financial fraudsters in Stop Scams In Their Tracks and Avoiding Online Investment Scams.)

Other Ways to Learn How to Trade
While trading courses offer a structured way of learning foreign exchange, they aren't the only option for a beginning trader.

Those who are talented self-learners can take advantage of free options online, such as trading books, free articles, professional strategies and fundamental and technical analysis. Again, even though the information is free, make sure it is from a credible source that has no bias in how or where you trade.

This can be a difficult way to learn, as good information is scattered, but for a trader starting out on a tight budget it can be well worth the time invested.

Conclusion
Before jumping in with the sharks, getting trading advice in the highly volatile forex marketplace should be a top priority. Success in stocks and bonds does not necessarily breed success in currency. Trading courses - either through individual mentoring or online learning - can provide a trader with all the tools for a profitable experience.

For more on this subject, read Basic Concepts For The Forex Market and Forex: Wading Into The Currency Market.

by David Hunt,

David J. Hunt serves as an editor for the News & Advance in Lynchburg, Virginia. He also works as a Forex consultant and private day trader with three years of experience in full-time fundamental analysis.


Read more...

How To Set A Forex Trading Schedule

by David Hunt


Many first-time forex traders hit the market running. They watch various economic calendars and trade voraciously on every release of data, viewing the 24-hours-a-day, five-days-a-week foreign exchange market as a convenient way to trade all day long. Not only can this strategy deplete a trader's reserves quickly, but it can burn out even the most persistent trader. Unlike Wall Street, which runs on normal business hours, the forex market runs on the normal business hours of four different parts of the world and their respective time zones, which means the trading day lasts all day and night.

So what's the alternative to staying up all night long? If traders can gain an understanding of the market hours and set appropriate goals, they will have a much stronger chance at realizing profits within a workable schedule.

Know the Markets
Currency trading is unique because of its hours of operation. The week begins at 6pm EST on Sunday and runs until 4pm on Friday.

But not all hours of the day are equally good for trading. The best time to trade is when the market is most active. When more than one of the four markets are open simultaneously, there will be a heightened trading atmosphere, which means there will be greater fluctuation in currency pairs. When only one market is open, currency pairs tend to get locked in a tight pip spread of roughly 30 pips of movement. Two markets open at once can easily see movement north of 70 pips, particularly when big news is released. (Need a refresher on forex concepts? Common Questions About Currency Trading covers the basics.)

First, here is a brief overview of the four markets (hours in EST):
  • New York (open 8am to 5pm): According to "Day Trading the Currency Markets" (2005) by Kathy Lien, New York is the second largest forex platform in the world and is watched heavily by foreign investors because the U.S. dollar is involved in 90% of all trades. Movements in the New York Stock Exchange (NYSE) can have an immediate and powerful effect on the dollar. When companies merge and acquisitions are finalized, the dollar can gain or lose value instantly. (Learn one way to predict movements in the NYSE in Which Direction Is The Market Heading?)

  • Tokyo (open 7pm to 4am): Tokyo takes in the largest bulk of Asian trading, just ahead of Hong Kong and Singapore. It was the first Asian trading center to open. The best currency pairs to aim for (for traders looking for a lot of action) are USD/JPY, GBP/CHF and GBP/JPY. The USD/JPY is an especially good pair to watch when the Tokyo market is the only market open because of the heavy influence the Bank of Japan has over the market. (Learn about this influence in Profiting From Interventions In Forex Markets, and about currency pairs in Using Currency Correlations To Your Advantage.)

  • Sydney (open 5pm to 2am): Sydney is where the trading day officially begins, and while it is the smallest of the mega-markets, it sees a lot of initial action when the markets reopen on Sunday afternoon because individual traders and financial institutions try to stabilize after all the action that may have happened since Friday afternoon.

  • London (open 3am to noon): The United Kingdom dominates the currency markets worldwide, and London is its main component. London, known as the trading capital of the world, accounts for roughly 34% of global trading, according to a report by IFS London. The city also has a big impact on currency fluctuations because the Bank of England, which sets interest rates and controls the monetary policy of the GBP, has set up shop in London. Forex trends often originate in London as well, which is a great thing for technical traders to keep in mind. (Learn more about how the central banks impact currency pairs in Interest Rates Matter For Forex Traders.)
Overlaps in Trading
As stated earlier, the best time to trade is when there is an overlap in trading times between open markets. Overlaps equal higher price ranges, resulting in greater opportunities. Here is a closer look at the three overlaps that happen each day:
  • U.S./London (8am to noon): The heaviest overlap within the markets occurs in the U.S./London markets. According to Kathy Lien, more than 70% of all trades happen when these markets overlap because the U.S. dollar and the euro are the two most popular currencies to trade. If a trader is looking for the most optimal time to trade (when volatility is high), than this would be the ideal time.

  • Sydney/Tokyo (2am to 4am): This time period is not as volatile as the U.S./London overlap, but it still offers a chance to trade in a period of higher pip fluctuation. The ideal currency pair to aim for in this period is the EUR/JPY pair, as these are the two main currencies influenced.

  • London/Tokyo (3am to 4am): This overlap sees the least amount of action of the three overlaps because of the time (most U.S.-based traders won't be awake at this time), and the one-hour overlap gives little opportunity to watch large pip changes occur.
(For more in-depth information about what kinds of market activity can be expected in each period, read The Forex Three-Session System.)

News Releases
While understanding the markets and their overlaps can aid a trader in arranging his or her trading schedule, there is one influence that should not be forgotten: the news release.
A big news release has the power to enhance a normally slow trading period. When a major announcement is made regarding economic data - especially when it goes against the predicted forecast - currency can lose or gain value within a matter of seconds.

However, just because dozens of economic releases happen each weekday in all time zones and seemingly affect all currencies, it does not mean a trader needs to be aware of all of them. It is important to prioritize these releases so that the important ones are watched and the lesser ones are simply monitored for surprises. (For more insight, read Trading On News Releases.)

Some of the bigger news releases to watch for include:
For more information on these indicators, read Economic Indicators To Know.

Conclusion
When setting up a trading schedule, it is important to run a strong balance between market overlaps and news releases. Traders looking to enhance profits should aim to trade during more volatile times, while keeping an eye on what economic data is released when. This balance allows part-time and full-time traders the opportunity to set a schedule that gives them peace of mind, knowing that opportunities are not slipping away when they are not watching the markets.

Read more...

Forex Education

Our Blogger Templates

  © Blogger templates Newspaper III by Ourblogtemplates.com 2008

Back to TOP