Uncover Forex Profits With The Turn Trade

by Kathy Lien and Boris Schlossberg


Most traders have an extremely hard time trading with the trend. This observation may seem counterintuitive, as the majority of traders claim that trend trading is their preferred approach to the market. However, after analyzing the records of thousands of retail traders, we are convinced the opposite is true. While everyone pays lip service to the idiom of "The trend is your friend", in reality, most traders love to pick tops and bottoms and constantly fade rather than trade with the trend. In this article, we'll cover the turn trade, a setup which allows traders to have their cake and eat it too: buying low and selling high while still trading with the trend. (For related reading, see Inside Day Bollinger Band Turn Trade.)

Turn Trade Basics
The turn trade recognizes the desire of most traders to find turns in the price action (that is to buy low and sell high), but it does so in the overarching framework of trading with the trend. The setup uses multiple time frames, moving averages and Bollinger band "bands" as its tools of entry. (For background reading, see The Basics Of Bollinger Bands.)

Getting Started
We begin by looking at the daily charts to ascertain whether a pair is in a trend, and used a 20-period daily simple moving average to determine the trend. In technical analysis, there are a number tools that can help us diagnose trend, but none is as simple and effective as the 20-period SMA. It includes a full month's worth of data (20 business days) and, as such, it provides us with a very good idea of an average price. Therefore, if price action is above the "average" price, we assume the pair is in an uptrend and vice versa.

Next, we move to the hourly charts to pinpoint our entries. In the turn to trend setup we will only trade in the direction of the trend by buying highly oversold prices in an uptrend and selling highly overbought prices in a downtrend. How will we determine our overbought and oversold extremes? The answer is by using Bollinger band "bands" to help us gauge the price action. Bollinger bands measure price extremes by calculating the standard deviation of price from its 20-period moving average. In the case of hourly charts, we will use Bollinger bands with three standard deviations (3SD) and Bollinger bands with two standard deviations (2SD) to create a set of Bollinger band channels. When price trades in a trend channel, most of the price action will be contained within the Bollinger band "bands" of 2SD and 1SD.

Why do we use the 3SD and 2SD settings in this particular setup? Because the Bollinger band rule applies to price action on the daily scale. In order to properly trade the hourly charts, which are more short term and therefore more volatile, we need to accommodate to those extremes in order to generate the most accurate signals possible. In fact, a good rule of thumb to remember is that traders should increase their Bollinger band values with every decrease in time frame. So, for example, with five-minute charts, traders may want to use Bollinger bands with setting of 3.5SD or even 4SD to focus on only the most oversold or overbought conditions.

Moving back to our setup, after having established the direction of the trend, we now observe the price action on the hourly charts. If price is in an uptrend on the dailies, we watch the hourlies for a turn back to the trend. If price continues to trade between the 3SD and the 2SD lower Bollinger band "bands", we stay away, as it indicates a strong downward momentum.

The beauty of this setup is that it prevents us from guessing the turn prematurely by forcing us to wait until the price action confirms a swing bottom or a swing top. In our example, if the price trades above the 2SD lower Bollinger band on the closing basis, we enter at market using the prior swing low minus five points as the stop. We set our target for the first unit at half the amount of risk; if it is hit, we move the stop to breakeven for the rest of the position. We then look for the second unit to trade up to the upper Bollinger band and exit the position only if the pair closes out of the 3SD-2SD Bollinger band channel, suggesting that the uptrend move is over.

Rules for the Long Trade
  1. On the daily setup, place a 20-period SMA and make sure that the price is above the moving average on a closing basis.
  2. Take only long trades in the direction of the trend.
  3. Move to the hourly charts and place two sets of Bollinger bands on the chart. The first pair of Bollinger bands should be set to 3SD and the second pair should be set to 2SD.
  4. Once the price breaks through and closes above the lower 3SD-2SD Bollinger band channel on an hourly basis, buy at market.
  5. Set stop at swing low minus five points and calculate your risk (Risk = Entry Price - Stop Price). (Traders who want to give the setup a little more room can use swing low minus 10 points as their stop.)
  6. Set a profit target for the first unit at 50% of risk (i.e., if you are risking 40 points on the trade then place a take-profit limit order 20 points above entry.)
  7. Move the stop to breakeven when the first profit target is hit.
  8. Exit the second unit when the price closes below the upper 3SD-2SD Bollinger band channel or at breakeven, whichever comes first.
Rules for the Short Trade
  1. On the daily setup, place a 20-period SMA and make sure that the price is below the moving average on the closing basis.
  2. Take only short trades in the direction of the trend.
  3. Move to the hourly charts and place two sets of Bollinger bands on the chart. The first pair of Bollinger bands should be set to 3SD and the second pair should be set to 2SD.
  4. Once price breaks through and closes above the upper 3SD-2SD Bollinger band channel on an hourly basis, sell at market.
  5. Set a stop at swing low plus five points and calculate your risk (Risk = Entry Price - Stop Price). (traders who want to give the setup a little more room can use swing high plus 10 points as their stop.)
  6. Set profit target for the first unit at 50% of risk (i.e., if you are risking 40 points on the trade, then place a take-profit limit order 20 points above entry).
  7. Move stop to breakeven when the first profit target is hit.
  8. Exit the second unit when price closes above the lower 3SD-2SD Bollinger band channel or at breakeven, whichever comes first.
The Turn Trade In Action
Now let's look at some examples:
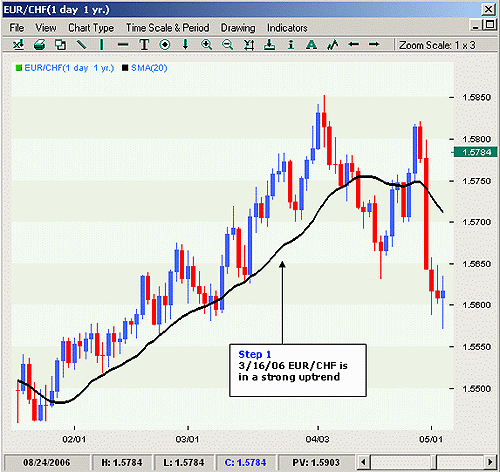
Figure 1: Turn to the Trend, EUR/CHF
Source: FXtrek Intellichart

Taking a look at the EUR/CHF daily chart in Figure 1, we see that since the middle of March 2006, EUR/CHF has traded above its 20-day SMA, indicating that it is in a clear uptrend.

Figure 2: Turn to the Trend, EUR/CHF
Source: FXtrek Intellichart

Turning to the hourlies, we wait until the pair breaks out of the lower Bollinger band 3SD-2SD zone to go long at market at 6pm EST on March 15, 2006, at 1.5635 with a stop at 1.5623, risking only 12 points. (Note that EUR/CHF tends to be a very low volatility currency pair providing us with very small risk setups. Because the risk is so small, we may choose to set our target at 100% of risk rather than the usual 50% of risk.)

Regardless of our choice, we are able to take profits at 3am EST on March 16, 2006, at 1.5651, banking 16 points on the first unit. We then move our stop to breakeven on the rest of the position and target the upper Bollinger band. We wait for the price to pierce the upper Bollinger band, trade within it; only when it falls out of the upper Bollinger 3SD-2SD band channel do we exit the rest of the position at 1pm EST on March 16, 2006, at 1.5692, earning 57 points on the second lot. Not bad for a trade on which we risked only 12 points.

Figure 3: Turn to the Trend, USD/CAD
Source: FXtrek Intellichart

The example of USD/CAD shown in Figure 3 and Figure 4 shows a classic turn to trend setup after it establishes an uptrend on March 7, 2006.

Figure 4: Turn to the Trend, USD/CAD
Source: FXtrek Intellichart

We move from the dailies to the hourly charts and wait until the prices recover above the lower Bollinger band, entering a long at market at 11am EST on March 16, 2006, at 1.1524. We place our stop at 1.1505, which is the swing low minus five pips for a miniscule 19-point risk.

At 10pm EST on March 16, 2006, as price makes a burst upward, we sell half the position at 1.1540 and move our stop to breakeven, locking in 16 points of profit. After the price makes another burst higher, we exit at the first hint of weakness, when the hourly candle closes below the 3SD-2SD Bollinger band zone. This occurs at 11am on March 17, 2006, and we close out the rest of our position at 1.1587, for a 63-point profit on the second half of the trade.

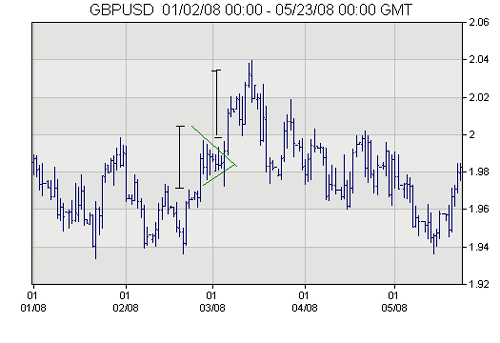
Figure 5: Turn to the Trend, GBP/USD
Source: FXtrek Intellichart

The example in Figure 5 shows a short trade. On February 15, 2006, we look at the daily chart and see that the GBP/USD is trading below its 20-day SMA, which indicates that it is in a clear downtrend.

In Figure 6, we turn our attention to the hourly chart and try to enter a high probability short when the price becomes overbought on a shorter-term time frame. We do this by waiting for the GBP/USD to close below the 3SD-2SD upper Bollinger band channel, at which time we sell at market (1.7440) and place our stop at approximately 1.7500, risking 60 points. As per our rules, we cover half the position at 1pm EST when price approaches the 1.7410 level, which is 30 points, or 50% of our risk.

Next, we move our stop at breakeven and hold the position, targeting the lower 3SD Bollinger band. Notice that the downtrend re-establishes itself with a vengeance and the price declines into our zone. We stay in the trade until the price breaks back out of the lower Bollinger band channel, indicating that downward momentum is waning. At 6am on February 16, 2006, we cover the rest of the trade at 1.7338, for a profit of 102 points.

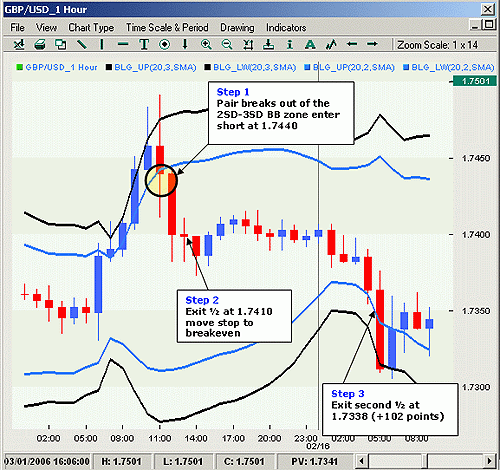
Figure 6: Turn to the Trend, GBP/USD
Source: FXtrek Intellichart

Figure 7 shows another good example of why we always scale out of our positions. On March 15, 2006 USD/CHF is in a downtrend, but the pair begins to trade back up to the 20-period SMA on the dailies. Because we can never be certain beforehand whether this is a retrace or a real turn in the trend, we adhere to the rules of the setup to control our risk.

Figure 7: Turn to the Trend, USD/CHF
Source: FXtrek Intellichart

Looking on the hourly charts in Figure 8, we see that at 1pm EST on March 21, 2006, the price closes below the upper Bollinger band 3SD-2SD level, and we enter a short at market at 1.3021. Our stop is placed five points above the swing high at 1.3042, for total risk of 21 points.

At 6pm EST on March 21, 2006, the price reaches our first target of 1.3008, and we cover one lot for 12 points of profit or approximately 50% of risk. We simultaneously move our stop to breakeven. At this point, the trade begins to move against us, but our breakeven stop insures that we do not lose any money and, in fact, still bank 12 points of profit on the first half of the position.

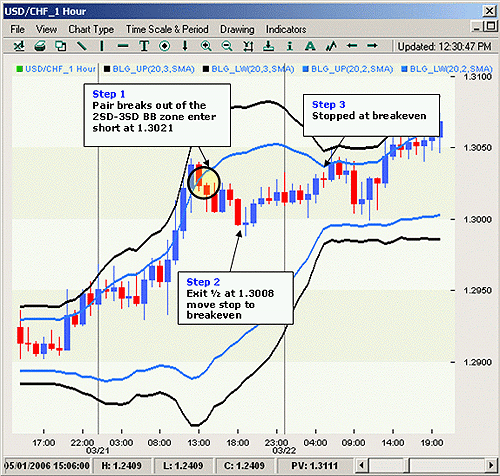
Figure 8: Turn to the Trend, USD/CHF
Source: FXtrek Intellichart

When The Setup Fails
Finally, let's take a look at an example of a failed setup in Figure 9. Starting on March 3, 2006, the EUR/GBP breaks above the 20-period SMA and establishes an uptrend on the daily charts.

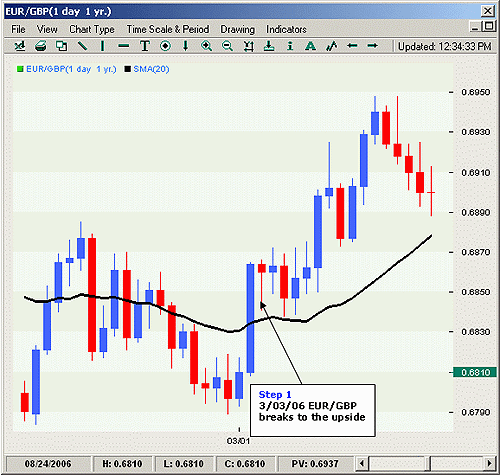
Figure 9: Turn to the Trend, EUR/GBP
Source: FXtrek Intellichart

Using our turn to trend approach, we wait for the pair to make a swing low in the 3SD-2SD Bollinger band zone and then enter long at .6881 at 10am EST on March 14, 2006. The swing low was created at 7am EST that same day at .6878, so we place our stop at .6873, five points below the swing low, risking a total of eight points. Note that the EUR/GBP pair is a very slow-moving cross with very high pip values. A point in the EUR/GBP is worth approximately 175% of a point in EUR/USD, so an eight-point risk in EUR/GBP would translate into a 14-point risk in EUR/USD.

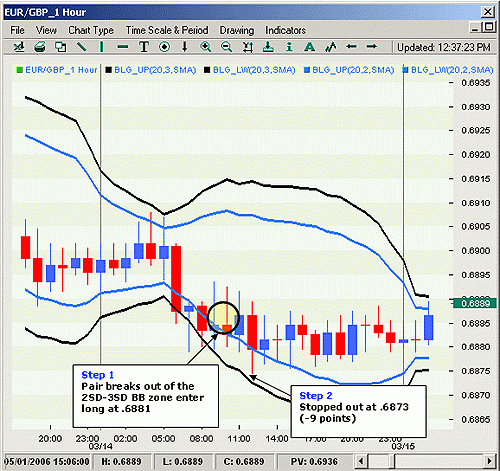
Figure 10: Turn to the Trend, EUR/GBP
Source: FXtrek Intellichart

Initially, the price makes a small rally but then drops to .6873 at noon EST on March 14, 2006, taking out our stop. This turns out to be the exact low of the move, and many traders may find it incredibly frustrating to be taken out of a trade just before it has a chance to turn around and generate profits. Not us, however. We realize that getting stopped on a bottom tick is just a part of trading and will probably happen more times than we care to remember. Far more important is to appreciate the risk management aspect of the trade, which leaves us only with a slight loss of eight points, thus preserving our capital and allowing us to look for other high probability setups.

To truly appreciate the importance of this dynamic, just imagine the following scenario. Instead of a stop loss, we leave the trade open and instead of turning around, it proceeds to drop even further. Before long, we may be looking at a floating loss in hundreds of points - something that would be inordinately more difficult to make up than our initial small eight-point stop.

Conclusion
Most traders love to pick tops and bottoms, rather than trade with the trend. The turn trade allows you to do both by using multiple time frames, moving averages and Bollinger band "bands" as its tools of entry.

Read more...

The Forex Three-Session System

by John Kicklighter

One of the greatest features of the foreign exchange market is that it is open 24 hours a day. This allows investors from around the world to trade during normal business hours, after work or even in the middle of the night. However, not all times are created equal. Although there is always a market for this most liquid of asset classes, there are times when price action is consistently volatile and periods when it is muted. What's more, different currency pairs exhibit varying activity over certain times of the trading day due to the general demographic of those market participants that are online at the time. In this article, we will cover the major trading sessions, explore what kind of market activity can be expected over the different periods and show how this knowledge can be adapted into a trading plan.

Breaking A 24-Hour Market Into Manageable Trading Sessions
While a 24-hour market offers a considerable advantage for many institutional and individual traders because it guarantees liquidity and the opportunity to trade at any conceivable time, it also has its drawbacks. Although currencies can be traded any time, a trader can only monitor a position for so long. This means that there will be times of missed opportunities, or worse, when a jump in volatility will lead the spot to move against an established position when the trader isn't around. To minimize this risk, a trader needs to be aware of when the market is typically volatile and decide what times are best for his or her strategy and trading style. (For more, see Trade To Your Taste.)

Traditionally, the market is separated into three sessions during which activity peaks: the Asian; European; and North American sessions. More casually, these three periods are also referred to as the Tokyo, London and New York sessions. These names are used interchangeably as the three cities represent the major financial centers for each of the regions. The markets are most active when these three powerhouses are conducting business as most banks and corporations make their day-to-day transactions and there is a greater concentration of speculators online. Now let's take a closer look at each of these sessions. (For more, see how does the foreign-exchange market trade 24 hours a day?)

Asian Session (Tokyo)
When liquidity is restored to the forex (or, FX) market after the weekend passes, the Asian markets are naturally the first to see action. Unofficially, activity from this part of the world is represented by the Tokyo capital markets, which are live from midnight to 6am Greenwich Mean Time. However, there are many other countries with considerable pull that are present during this period including China, Australia, New Zealand and Russia, among others. Considering how scattered these markets are, it stands to reason that the beginning and end of the Asian session are stretched beyond the standard Tokyo hours. Allowing for these different markets' activity, Asian hours are often considered to run between 11pm and 8am GMT.


European Session (London)
Later in the trading day, just before the Asian trading hours come to a close, the European session takes over in keeping the currency market active. This FX time zone is very dense and includes a number of major financial markets that could stand in as the symbolic capital. However, London ultimately takes the honors in defining the parameters for the European session. Official business hours in London run between 7:30am and 3:30pm GMT. Once again though, this trading period is expanded due to other capital markets' presence (including Germany and France) before the official open in the U.K.; while the end of the session is pushed back as volatility holds until the London fix after the close. Therefore, European hours are typically seen as running from 7am to 4pm GMT.

North American Session (New York)
By the time the North American session comes on line, the Asian markets have already been closed for a number of hours, but the day is only half through for European traders. The Western session is dominated by activity in the U.S. with few contributions from Canada, Mexico and a number of countries in South America. As such, it comes as little surprise that activity in New York City marks the high in volatility and participation for the session. Taking into account the early activity in financial futures, commodity trading and the concentration of economic releases the North American hours unofficially begin at noon GMT. With a considerable gap between the close of the U.S. markets and open of the Asian trading, a lull in liquidity sets the close of New York exchange trading at 8pm GMT as the North American session close.

Session Major Market Hours (GMT)
Asian Session Tokyo 11pm to 8am
European Session London 7am to 4pm
North American Session New York noon to 10pm
Figure 1: Major market session hours

Figure 2: Three-market session overlap
Copyright Ó 2008 Investopedia.com

Measuring Market Activity
Now that we know when the Asian, European and North American sessions are and what markets comprise each, we should discuss how time and participation affect price action for different currencies.

As logic would suggest, a currency is typically most active when its own markets are open. For example, the euro, British pound and Swiss franc see higher volatility on average when the European session is active. This is the case because banks, businesses and traders from any specific country will use their domestic currency in the majority of their foreign exchange transactions. What's more, it is more difficult for a market participant to buy or sell a currency from a region where all the major banks are closed. To illustrate, if a U.S. bank wants to make a multibillion dollar currency exchange for euros, it would likely do so when European banks are online and there is a greater pool of liquidity. Otherwise, large orders in a thin market would result in prices moving away from the ideal entry point as the order is processed.


The above example further highlights another truism for the currency markets: price action is usually greatest when the sessions overlap. When traders, banks and business from two different sessions are online, there are more participants in the market and, therefore, a greater level of liquidity is available. Figure 3 below charts the average hourly range for the seven majors in the two years through 2007. A quick glance at this graph reveals what we would expect - two notable peaks in price action. The first rise in price action occurs around the closing hours of the Asian session and open of the European session (around 7am GMT). Before this peak, the markets in the Far East are carrying currency volatility alone. After the Japanese session closes, there is a clear drop in the ranges for most of the majors as Asian liquidity quickly evaporates and leaves traders in Europe to keep the fires of volatility stoked. (For more, see Getting Started In Forex.)

The second and larger jump in activity is seen when the North American and European sessions converge (between noon and 4pm GMT). This four-hour overlap is far greater than the Asian/European sessions' own union, and volatility clearly benefits from the greater period of liquidity. However, from this period we can see there is another factor at work in driving price action - otherwise there would not be a consistent dip across the majors at 1pm GMT. This particular influence is the presence of fundamental releases. Most of the top market moving indicators for the U.S. cross the wires at either noon or 2pm GMT and thereby boost the average range for those times. And, while the influence of the U.S. data is the clearest example here, fundamentals from other key markets certainly influence price action as well. Another obvious instance of this dynamic is the typical release time for U.K. data (around 8am GMT), which coincides with a sharp peak in GBP/USD activity that goes beyond the Asian/European session overlap and cooling of the other major pairs.

Figure 3: Currency market volatility
Copyright Ó 2008 Investopedia.com

Another aspect to take into consideration is that while broad market activity typically follows the same trend as seen across the majors (a peak in volatility during the two session overlaps), each pair is unique depending on its two component currencies and which underlying sessions they belong to. For example, when a pair is made up of two currencies from the same session (let's say USD/CAD), there will likely be a relatively greater level of volatility during that session (the U.S. session) while price action is subsequently more muted during the market's other high points (the Asian/European session overlap).

In contrast, if the pair is a cross made of currencies that are most actively traded during Asian and European hours (like EUR/JPY and GBP/JPY), there will be a greater response to the Asian/European session overlaps and a less dramatic increase in price action during the European/U.S. sessions' concurrence. Of course, the presence of scheduled event risk for each currency will still have a substantial influence on activity regardless of the pair or its components' respective sessions.


Figure 4: A greater response to Asian/European session overlaps is shown in pairs that are actively traded during Asian and European hours.
Copyright Ó 2008 Investopedia.com

How To Weave This Into a Trading Strategy
There are few things more important to successful trading than market activity. Even the best strategy could fall apart if it is applied during the wrong session. For long-term or fundamental traders, trying to establish a position during a pair's most active hours could lead to a poor entry price, a missed entry or a trade that counters the strategy's rules. On the other hand, for short-term traders who do not hold a position over night, volatility is vital. (For more, see The Fundamentals Of Forex Fundamentals.)

Conclusion
When trading currencies, a market participant must first determine whether high or low volatility will work best with their personality and trading style. If more substantial price action is desired, trading the session overlaps or typical economic release times may be the preferable option. The next step would be to decide what times are best to trade given the bias for volatility. Following with a desire for high volatility, a trader will then need to determine what time frames are most active for the pair he or she is looking to trade.

When considering the EUR/USD pair, the European/U.S. session crossover will find the most movement. However, there are usually alternatives, and a trader should balance the need for favorable market conditions with physical well-being. If a market participant from the U.S. prefers to trade the active hours for GBP/JPY, he or she will have to wake up very early in the morning to keep up with the market. If this person has a regular day job, this could lead to exhaustion and errors in judgment when trading. A better alternative for this particular trader may be trading during the European/U.S. session overlap, where volatility is still elevated even though Japanese markets are offline.


by John Kicklighter,

John Kicklighter is a currency analyst at the world's largest retail forex market maker, Forex Capital Markets LLC in New York. He writes a number of daily, weekly and ad hoc articles for DailyFX.com, FXCM's research branch, covering both fundamental and technical trends in the currency market. He also authors daily reports for FXCM clients highlighting potential range and event risk trades. John has been an active trader since the age of 17 and has traded stocks, financial futures, commodities, spot currency and options on all these instruments for his own account. John graduated with a bachelor's degree in finance and investment from Baruch College in New York.


Read more...

Trade Forex With A Directional Strategy

by David Gonzalez,CMT


Forex was once a marketplace available only to governments, central banks, commercial and investment banks and other institutional investors like hedge funds. Today, however, there are many venues where just about anyone can trade currencies. These include currency futures, options on futures, PHLX-listed foreign currency options and the largely unregulated over-the-counter (OTC) forex market. Once the forex trader has decided which venue(s) and instrument(s) he or she will trade, it's time to develop a well-conceived trading strategy before putting any trading capital at risk. Successful traders must also predetermine their exit strategies and other risk-management tactics to be used should a trade go against them. Here we look at how to develop a trading strategy for the currency markets based on directional trading.(To review some of the concepts in this piece, check out Basic Concepts For The Forex Market and Common Questions About Currency Trading.)

Develop a Trading Strategy
One way to organize the multitude of potential strategies is to group them into directional and non-directional approaches. Directional trading strategies take net long or short positions in a market, as opposed to nondirectional (market-neutral) strategies. Most investors are familiar with the directional approach; for example, millions of people participate in some form of retirement program, which is basically a long-term portfolio of equity and/or debt securities held long by the investor. Net long strategies are profitable in rising markets, while net short investors should profit in falling markets. Directional strategies can be loosely grouped into the following subcategories:

This list is not all-inclusive, as there are many other approaches to trading forex. (For more, read Trading Double Tops And Double Bottoms and Identifying Trending & Range-Bound Currencies.)

Trend-Following Strategies
Trend-following systems create signals for traders to initiate positions once a specific price move has occurred. These systems are based on the technical premise that once a trend has been established, it is more likely to continue rather than reverse. (Read more about trends in the forex market in Trading Trend Or Range?)

Moving-Average (MA) Crossover
The moving average (MA) crossover trading system is one of the most common directional systems in use today. This system uses two MAs. Buy signals are generated when the shorter-term, faster-moving MA crosses over the longer average. This indicates that the near-term price action is accelerating to the upside.

These systems are susceptible to false signals, or "whipsaws". As such, traders should experiment with different time periods and conduct other backtesting before trading.

Figure 1
Source: forex.tradingcharts.com


This crossover system posted a buy signal when the five-day crossed over the 20-day to the upside in March 2008, on the left side of the chart. The position is closed once either a downside crossover occurs (as posted in May, right side of chart), or the trade reaches a predetermined price objective.

Breakout Systems

Breakout systems are extremely easy to develop. They are basically a set of predefined trading rules based on the simple premise that a price move to a new high or low is an indication of a continuing trend. Therefore, the system triggers an action to open a position in the direction of the new high/low.

For example, a breakout system may state that the trader should close all shorts and open a long position if the day's closing price exceeds the high price for the past X days. Part two of the same breakout system will state that the trader must close longs and open a short position if the day's close is below the X day's low print. The secret is to determine how long of a period you'd like to trade. Shorter time periods (faster systems) will detect trending markets faster than slower systems. The drawback is that more whipsaws will occur with faster systems.


Pattern-Recognition Strategies
A thorough discussion of every pattern used by forex traders is obviously beyond the scope of this article. As such, we will look at a few popular continuation patterns used by traders. (For more on charts patterns, read Price Patterns - Part 1.)

Triangles
Triangles can signal trend reversals, but most often they are continuation patterns (meaning that the resolution of the triangle will result in the resumption of the prior trend). There are several different types of triangles, each possessing its own unique characteristics and forecasting implications.

Traders should open positions once the price action breaks out beyond the converging boundaries of the triangle. In this case, the trader will buy the British pound once the price breaks out above the upper boundary near 1.99.

One way to forecast the extent of the resulting move is to measure the distance of the triangle base and add that distance to the level where the breakout occurred (~.04 to ~.05 + 1.99 = 2.04)

Figure 2: Symmetrical pattern at the midpoint of a bullish move
Source: forex.tradingcharts.com


Flags
Flags are continuation or consolidation patterns that usually display a period of back and forth action sloped against the primary trend. Pennants have shown to be extremely reliable. They almost always consolidate the prevailing trend and very rarely signifying a trend reversal. As with triangles, traders should open positions upon a breach of the boundary. Like other continuation patterns, flags often occur near the midpoint of a primary move.

Figure 3: Textbook bullish flag, sloped against the direction of the primary trend
Source: forex.tradingcharts.com


Risk-Management Tactics
There are a number of ways traders can reduce risk and avoid the catastrophic losses that will wipe out trading capital. Traders can set arbitrary points at which they must exit losing positions. They can also place stop orders. Another popular way to trade is to design mechanical trading systems or so-called black-box systems that use an overriding preprogrammed logic to make all trading decisions.

There are several perceived benefits to using mechanical trading systems. One is that the core danger emotions of fear and greed are eliminated from the bulk of your trading. These systems help traders avoid common mistakes such as excessive trading and closing positions prematurely. Another benefit is consistency. All signals are followed because the market conditions required to trigger a signal are detected by the system. Mechanical systems naturally force traders to control losses, since a reversal will arbitrarily trigger a new signal, reversing or closing the open position. (Read more about the effects of excessive trading on your portfolio in Tips For Avoiding Excessive Trading.)

Mechanical systems are only as good as the input data and backtesting conducted before beginning the trading campaign. The simple reality is that there is no perfect way to simulate real market conditions. Eventually, the trader must enter the markets and put real money at risk. You can paper-trade and backtest all you want, but the true test is when you go live.

Parting Words
Traders must always review and evaluate the efficacy of their strategies. Market conditions are constantly changing, and traders must adapt their systems to whatever market conditions they find themselves in.

by David Gonzalez

David Gonzalez, CMT, is a Chartered Market Technician based in Orlando, Fla. He serves as the chapter chair for the Market Technicians Association's Florida Region.

Read more...

Forex Courses Teach Beginners How To Trade

by David Hunt

Investors looking to enter the world of foreign exchange can find themselves frustrated and quickly spiraling downward, losing capital rapidly and optimism even faster. Investing in forex - whether in futures, options or spot - offers great opportunity, but it is a vastly different atmosphere than the equities market. Even the most successful stock traders will fail miserably in forex by treating the markets similarly. Equity markets involve the transfer of ownership, while the currency market is run by pure speculation. But there are solutions to help investors get over the learning curve - trading courses. (Currency trading offers far more flexibility than other markets, but long-term success requires discipline in money management. Learn more in Forex: Money Management Matters.)

What's Out There?
When it comes to forex trading courses, there are two main categories:
  1. Online courses
  2. Individual training
Online courses can be compared to distance learning in a college-level class. An instructor provides PowerPoint presentations, ebooks, trading simulations and so on. A trader will move through the beginner, intermediate and advanced levels that most online courses offer. For a trader with limited foreign exchange knowledge, a course like this can be invaluable. These courses can range from $50 to well into the hundreds of dollars. (If you're a beginner, check out Common Questions About Currency Trading for an overview of basic concepts.)

Individual training is much more specific, and it is advised that a trader have basic forex training before entering. An assigned mentor, typically a successful trader, will go through strategy and risk management but spend the bulk of the time teaching through placing actual trades. Individual training runs between $1,000 and $10,000.

What to Look For
No matter which type of training a trader selects, there are several things he or she should examine prior to signing up:
  • Reputation of the course: A simple Google search shows roughly two million results for "forex trading courses". To narrow the search, focus on the courses that have solid reputations. There are many scams promising giant returns and instant money (more on this later). Don't believe the hype. A solid training program won't promise anything but useful information and proven strategies. (Read Getting Started In Forex for more on defining a strategy.)
A course's reputation is best gauged by talking with other traders and participating in online forums. The more information you can gather from people who have taken these courses, the more confident you can be that you will make the right choice.
However, each country has its own regulatory boards, and international courses may be certified by different organizations.
  • Time/cost: Trading courses can require a solid commitment (if individual mentoring is involved) or can be as flexible as online podcast classes (for internet-based learning). Before choosing a course, carefully examine the time and cost commitments, as they vary widely.
If you don't have several thousand dollars budgeted for one-on-one training, you are probably better off taking an online course. However, if you plan on quitting your job to trade full-time, it would be beneficial to seek professional advice - even at the higher cost. (Read Get Into A Broker Training Program for more information on becoming a broker.)

Staying Away From Scams
"Make 400% returns in a day!" . . . "Guaranteed profits!" . . . "No way to lose!"

These and other catchphrases litter the internet, promising the perfect trading course leading to success. While these sites may be tempting, beginning day traders should steer clear, because any guarantee in the world of foreign exchange is a scam. (Read more about day trading in Would You Profit As A Day Trader?)

According to the Commodity Futures Trading Commission (CFTC) in a May 2008 release, forex scams are on the rise:

"The CFTC has witnessed increasing numbers, and a growing complexity, of financial investment opportunities in recent years, including a sharp rise in foreign currency (forex) trading scams.

The Commodity Futures Modernization Act of 2000 (CFMA) made clear that the CFTC has jurisdiction and authority to investigate and take legal action to close down a wide assortment of unregulated firms offering or selling foreign currency futures and options contracts to the general public."

To ensure a trading course is not a scam, read its terms and conditions carefully, determine whether it promises anything unreasonable and double-check its certification for authenticity. (Find out how to protect yourself and your loved ones from financial fraudsters in Stop Scams In Their Tracks and Avoiding Online Investment Scams.)

Other Ways to Learn How to Trade
While trading courses offer a structured way of learning foreign exchange, they aren't the only option for a beginning trader.

Those who are talented self-learners can take advantage of free options online, such as trading books, free articles, professional strategies and fundamental and technical analysis. Again, even though the information is free, make sure it is from a credible source that has no bias in how or where you trade.

This can be a difficult way to learn, as good information is scattered, but for a trader starting out on a tight budget it can be well worth the time invested.

Conclusion
Before jumping in with the sharks, getting trading advice in the highly volatile forex marketplace should be a top priority. Success in stocks and bonds does not necessarily breed success in currency. Trading courses - either through individual mentoring or online learning - can provide a trader with all the tools for a profitable experience.

For more on this subject, read Basic Concepts For The Forex Market and Forex: Wading Into The Currency Market.

by David Hunt,

David J. Hunt serves as an editor for the News & Advance in Lynchburg, Virginia. He also works as a Forex consultant and private day trader with three years of experience in full-time fundamental analysis.


Read more...

How To Set A Forex Trading Schedule

by David Hunt


Many first-time forex traders hit the market running. They watch various economic calendars and trade voraciously on every release of data, viewing the 24-hours-a-day, five-days-a-week foreign exchange market as a convenient way to trade all day long. Not only can this strategy deplete a trader's reserves quickly, but it can burn out even the most persistent trader. Unlike Wall Street, which runs on normal business hours, the forex market runs on the normal business hours of four different parts of the world and their respective time zones, which means the trading day lasts all day and night.

So what's the alternative to staying up all night long? If traders can gain an understanding of the market hours and set appropriate goals, they will have a much stronger chance at realizing profits within a workable schedule.

Know the Markets
Currency trading is unique because of its hours of operation. The week begins at 6pm EST on Sunday and runs until 4pm on Friday.

But not all hours of the day are equally good for trading. The best time to trade is when the market is most active. When more than one of the four markets are open simultaneously, there will be a heightened trading atmosphere, which means there will be greater fluctuation in currency pairs. When only one market is open, currency pairs tend to get locked in a tight pip spread of roughly 30 pips of movement. Two markets open at once can easily see movement north of 70 pips, particularly when big news is released. (Need a refresher on forex concepts? Common Questions About Currency Trading covers the basics.)

First, here is a brief overview of the four markets (hours in EST):
  • New York (open 8am to 5pm): According to "Day Trading the Currency Markets" (2005) by Kathy Lien, New York is the second largest forex platform in the world and is watched heavily by foreign investors because the U.S. dollar is involved in 90% of all trades. Movements in the New York Stock Exchange (NYSE) can have an immediate and powerful effect on the dollar. When companies merge and acquisitions are finalized, the dollar can gain or lose value instantly. (Learn one way to predict movements in the NYSE in Which Direction Is The Market Heading?)

  • Tokyo (open 7pm to 4am): Tokyo takes in the largest bulk of Asian trading, just ahead of Hong Kong and Singapore. It was the first Asian trading center to open. The best currency pairs to aim for (for traders looking for a lot of action) are USD/JPY, GBP/CHF and GBP/JPY. The USD/JPY is an especially good pair to watch when the Tokyo market is the only market open because of the heavy influence the Bank of Japan has over the market. (Learn about this influence in Profiting From Interventions In Forex Markets, and about currency pairs in Using Currency Correlations To Your Advantage.)

  • Sydney (open 5pm to 2am): Sydney is where the trading day officially begins, and while it is the smallest of the mega-markets, it sees a lot of initial action when the markets reopen on Sunday afternoon because individual traders and financial institutions try to stabilize after all the action that may have happened since Friday afternoon.

  • London (open 3am to noon): The United Kingdom dominates the currency markets worldwide, and London is its main component. London, known as the trading capital of the world, accounts for roughly 34% of global trading, according to a report by IFS London. The city also has a big impact on currency fluctuations because the Bank of England, which sets interest rates and controls the monetary policy of the GBP, has set up shop in London. Forex trends often originate in London as well, which is a great thing for technical traders to keep in mind. (Learn more about how the central banks impact currency pairs in Interest Rates Matter For Forex Traders.)
Overlaps in Trading
As stated earlier, the best time to trade is when there is an overlap in trading times between open markets. Overlaps equal higher price ranges, resulting in greater opportunities. Here is a closer look at the three overlaps that happen each day:
  • U.S./London (8am to noon): The heaviest overlap within the markets occurs in the U.S./London markets. According to Kathy Lien, more than 70% of all trades happen when these markets overlap because the U.S. dollar and the euro are the two most popular currencies to trade. If a trader is looking for the most optimal time to trade (when volatility is high), than this would be the ideal time.

  • Sydney/Tokyo (2am to 4am): This time period is not as volatile as the U.S./London overlap, but it still offers a chance to trade in a period of higher pip fluctuation. The ideal currency pair to aim for in this period is the EUR/JPY pair, as these are the two main currencies influenced.

  • London/Tokyo (3am to 4am): This overlap sees the least amount of action of the three overlaps because of the time (most U.S.-based traders won't be awake at this time), and the one-hour overlap gives little opportunity to watch large pip changes occur.
(For more in-depth information about what kinds of market activity can be expected in each period, read The Forex Three-Session System.)

News Releases
While understanding the markets and their overlaps can aid a trader in arranging his or her trading schedule, there is one influence that should not be forgotten: the news release.
A big news release has the power to enhance a normally slow trading period. When a major announcement is made regarding economic data - especially when it goes against the predicted forecast - currency can lose or gain value within a matter of seconds.

However, just because dozens of economic releases happen each weekday in all time zones and seemingly affect all currencies, it does not mean a trader needs to be aware of all of them. It is important to prioritize these releases so that the important ones are watched and the lesser ones are simply monitored for surprises. (For more insight, read Trading On News Releases.)

Some of the bigger news releases to watch for include:
For more information on these indicators, read Economic Indicators To Know.

Conclusion
When setting up a trading schedule, it is important to run a strong balance between market overlaps and news releases. Traders looking to enhance profits should aim to trade during more volatile times, while keeping an eye on what economic data is released when. This balance allows part-time and full-time traders the opportunity to set a schedule that gives them peace of mind, knowing that opportunities are not slipping away when they are not watching the markets.

Read more...

Top 8 Most Tradeable Currencies

by Richard Lee


Although the foreign exchange market is often billed as a banker's game, currencies can sometimes be great diversification for a portfolio that might have hit a bit of a rut. It's a market that can also offer tremendous opportunity when other global forums enter the doldrums. As a result, knowing a little bit about forex, and the fundamentals behind it, can make significant additions to any trader, investor or portfolio manager's arsenal. Let's take a look at eight currencies every trader or investor should know, along with the central banks of their respective nations. (Absolute beginners might consider a trading course. Read Forex Courses Teach Beginners How To Trade for more information.)

1. U.S. Dollar (USD)
Central Bank: Federal Reserve (Fed)
Current Interest Rate Information: http://www.federalreserve.gov/releases/h15/data.htm

The Almighty Dollar
Created in 1913 by the Federal Reserve Act, the Federal Reserve System (also called the Fed) is the central banking body of the U.S. The system is itself headed by a chairman and board of governors, with most of the focus being placed on the branch known as the Federal Open Market Committee (FOMC). The FOMC supervises open market operations as well as monetary policy or interest rates.

The current committee is comprised of five of the 12 current Federal Reserve Bank presidents and seven members of the Federal Reserve Board, with the Federal Reserve Bank of New York always serving on the committee. Even though there are 12 voting members, non-members (including additional Fed Bank presidents) are invited to share their views on the current economic situation when the committee meets every six weeks. (For more information on the Federal Reserve, read our Federal Reserve tutorial.)

Sometimes referred to as the greenback, the U.S. dollar (USD) is the home denomination of the world's largest economy, the United States. As with any currency, the dollar is supported by economic fundamentals, including gross domestic product, and manufacturing and employment reports. However, the U.S. dollar is also widely influenced by the central bank and any announcements about interest rate policy. The U.S. dollar is a benchmark that trades against other major currencies, especially the euro, Japanese yen and British pound. (For further reading about trading this currency, see Taking Advantage Of A Weak U.S. Dollar.)

2. European Euro (EUR)
Central Bank: European Central Bank (ECB)
Current Interest Rate: http://www.ecb.int/stats/monetary/rates/html/index.en.html

The Dollar's Nemesis
Headquartered in Frankfurt, Germany, the European Central Bank is the central bank of the 15 member countries of the Eurozone. In similar fashion to the United States' FOMC, the ECB has a main body responsible for making monetary policy decisions, the Executive Council, which is composed of five members and headed by a president. The remaining policy heads are chosen with consideration that four of the remaining seats are reserved for the four largest economies in the system, which include Germany, France, Italy and Spain. This is to ensure that the largest economies are always represented in the case of a change in administration. The council meets approximately 10 times a year. (Read more about this and other central banks discussed here in Get To Know The Major Central Banks.)

In addition to having jurisdiction over monetary policy, the ECB also holds the right to issue banknotes as it sees fit. Similarly to the Federal Reserve, policy makers can interject at times of bank or system failures. The ECB differs from the Fed in an important area: instead of maximizing employment and maintaining stability of long-term interest rates, the ECB works towards a prime principle of price stability, with secondary commitments to general economic policies. As a result, policymakers will turn their focus to consumer inflation in making key interest rate decisions. (Read more about how central banks control inflation in What Are Central Banks?)

Although the monetary body is somewhat complex, the currency is not. Against the U.S. dollar, the euro (EUR) tends to be a slower currency compared to its colleagues (i.e., the British pound or Australian dollar). On an average day, the base currency can trade between 30-40 pips, with more volatile swings averaging slightly more, at 60 pips wide per day. Another trading consideration is time. Trading in the euro-based pairs can be seen during the London and U.S. sessions (which occur from 2am through 11am EST). (Read more about choosing the optimal time to trade in How To Set A Forex Trading Schedule.)

3. Japanese Yen (JPY)
Central Bank: Bank of Japan (BoJ)
Current Interest Rate: http://www.boj.or.jp/en/index.htm

Technically Complex, Fundamentally Simple
Established as far back as 1882, the Bank of Japan serves as the central bank to the world's second largest economy. It governs monetary policy as well as currency issuance, money market operations and data/economic analysis. The main Monetary Policy Board tends to work toward economic stability, constantly exchanging views with the reigning administration, while simultaneously working toward its own independence and transparency. Meeting 12-14 times a year, the governor leads a team of nine policy members, including two appointed deputy governors.

The Japanese yen (JPY) tends to trade under the identity of a carry trade component. Offering a low interest rate, the currency is pitted against higher-yielding currencies, especially the New Zealand and Australian dollars and the British pound. As a result, the underlying tends to be very erratic, pushing traders to take technical perspectives on a longer-term basis. Average daily ranges are in the region of 30-40 pips, with extremes as high as 150 pips. To trade this currency with a little bit of a bite, focus on the crossover of London and U.S. hours (6am - 11am EST). (Read more about forex carry trades in Currency Carry Trades Deliver.)

4. British Pound (GBP)
Central Bank: Bank of England (BoE)
Current Interest Rate: http://www.bankofengland.co.uk/

The Queen's Currency
As the main governing body in the United Kingdom, the Bank of England serves as the monetary equivalent of the Federal Reserve System. In the same fashion, the governing body establishes a committee headed by the governor of the bank. Made up of nine members, the committee includes four external participants (appointed by the Chancellor of Exchequer), a chief economist, director of market operations, committee chief economist and two deputy governors.

Meeting every month of the year, the Monetary Policy Committee (MPC) decides on interest rates and broader monetary policy, with primary considerations of total price stability in the economy. As such, the MPC also has a benchmark of consumer price inflation set at 2%. If this benchmark is compromised, the governor has the responsibility to notify the Chancellor of Exchequer through a letter, one of which came in 2007 as the U.K. CPI rose sharply to 3.1%. The release of this letter tends to be a harbinger to markets, as it increases the probability of contractionary monetary policy. (For more on the role of the CPI, read The Consumer Price Index: A Friend To Investors.)

A little bit more volatile than the euro, the British pound (GBP, also sometimes referred to as "pound sterling" or "cable") tends to trade a wider range through the day. With swings that can encompass 100-150 pips, it isn't unusual to see the pound trade as narrowly as 20 pips. Swings in notable cross currencies tend to give this major a volatile nature, with traders focusing on pairs like the British pound/Japanese yen and the British pound/Swiss franc. As a result, the currency can be seen as most volatile through both London and U.S. sessions, with minimal movements during Asian hours (5pm - 1am EST). (Read more about currency pairs in Using Currency Correlations To Your Advantage.)

5. Swiss Franc (CHF)
Central Bank: Swiss National Bank (SNB)
Current Interest Rate: http://www.snb.ch/en/iabout/stat/statpub/zidea/id/current_interest_exchange_rates

A Banker's Currency
Different from all other major central banks, the Swiss National Bank is viewed as a governing body with private and public ownership. This belief stems from the fact that the Swiss National Bank is technically a corporation under special regulation. As a result, a little over half of the governing body is owned by the sovereign states of Switzerland. It is this arrangement that emphasizes the economic and financial stability policies dictated by the governing board of the SNB. Smaller than most governing bodies, monetary policy decisions are created by three major bank heads who meet on a quarterly basis.

The governing board creates the band (plus or minus 25 basis points) of where the interest rate will reside.

Similar to the euro, the Swiss franc (CHF) hardly makes significant moves in the any of the individual sessions. As a result, look for this particular currency to trade in the average daily range of 35 pips per day. High-frequency volume for this currency is usually pitted for the London session (2am - 8am EST). (For more on the CHF, read Forex: Making Sense Of The Euro/Swiss Franc Relationship.)

6. Canadian Dollar (CAD)
Central Bank: Bank of Canada (BoC)
Current Interest Rate: http://www.bankofcanada.ca/en/rates/interest-look.html

The Loonie
Established by the Bank of Canada Act of 1934, the Bank of Canada serves as the central bank called upon to "focus on the goals of low and stable inflation, a safe and secure currency, financial stability and the efficient management of government funds and public debt." Acting independently, Canada's central bank draws similarities with the Swiss National Bank because it is sometimes treated as a corporation, with the Ministry of Finance directly holding shares. Despite the proximity of the government's interests, it is the responsibility of the governor to promote price stability at an arm's length from the current administration, while simultaneously considering the government's concerns. With an inflationary benchmark of 2-3%, the BoC has tended to remain a shade more hawkish rather than accommodative when it comes to any deviations in prices.

Keeping in touch with major currencies, the Canadian dollar (CAD) tends to trade in similar daily ranges of 30-40 pips. However, one unique aspect about the currency is its relationship with crude oil, as the country remains a major exporter of the commodity. As a result, plenty of traders and investors use this currency as either a hedge against current commodity positions or pure speculation, tracing signals from the oil market. (Read more about the CAD's relationship with oil in Commodity Prices And Currency Movements.)

7. Australian/New Zealand Dollar (AUD/NZD)
Central Bank: Reserve Bank of Australia / Reserve Bank of New Zealand (RBA/RBNZ)
Current Interest Rate: http://www.rba.gov.au/ and http://www.rbnz.govt.nz/

Always A Carry Favorite
Offering one of the higher interest rates in the major global markets, the Reserve Bank of Australia has always upheld price stability and economic strength as cornerstones of its long-term plan. Headed by the governor, the bank's board is made up of six members-at-large, in addition to a deputy governor and a secretary of the Treasury. Together, they work toward to target inflation between 2-3%, while meeting nine times throughout the year. In similar fashion, the Reserve Bank of New Zealand looks to promote inflation targeting, hoping to maintain a foundation for prices.

Both currencies have been the focus of carry traders, as the Australian and New Zealand dollars (AUD and NZD) offer the highest yields of the seven major currencies available on most platforms. As a result, volatility can be experienced in these pairs if a deleveraging effect takes place. Otherwise, the currencies tend to trade in similar averages of 30-40 pips, like other majors. Both currencies also maintain relationships with commodities, most notably silver and gold. (Read more about carry trades and the AUD in Turn To The Carry – A Different Flavor Of The Setup.)

8. South African Rand (ZAR)
Central Bank: South African Reserve Bank (SARB)
Current Interest Rate: http://www.reservebank.co.za/

Emerging Opportunity
Previously modeled on the United Kingdom's Bank of England, the South African Reserve Bank stands as the monetary authority when it comes to South Africa. Taking on major responsibilities similar to those of other central banks, the SARB is also known as a creditor in certain situations, a clearing bank and major custodian of gold. Above all else, the central bank is in charge of "the achievement and maintenance of price stability". This also includes intervention in the foreign exchange markets when the situation arises.

Interestingly enough, the South African Reserve Bank remains a wholly owned private entity with more than 600 shareholders that are regulated by owning less than 1% of the total number of outstanding shares. This is to ensure that the interests of the economy precede those of any private individual. To maintain this policy, the governor and 14-member board head the bank's activities and work toward monetary goals. The board meets six times a year.

Seen as relatively volatile, the average daily range of the South African rand (ZAR) can be as high as 1,000 pips. But don't let the wide daily range fool you. When translated into dollar pips, the movements are equivalent to an average day in the British pound, making the currency a great pair to trade against the U.S. dollar (especially when taking into consideration the carry potential). Traders also consider the currency's relationship to gold and platinum. With the economy being a world leader when it comes to exports of both metals, it is only natural to see a correlation similar to that between the CAD and crude oil. As a result, consider the commodities markets in creating opportunities when economic data is scant. (Read more about the rand in The New World Of Emerging Market Currencies.)

Conclusion
As financial markets continue to evolve and grow globally, foreign exchange and currencies will play an increasingly large role in day-to-day transactions. Notional volumes for the market sector are already averaging approximately $3 trillion per day. As a result, whether a conversion for physical trade or a simple portfolio diversification play, currencies continue to offer more opportunities to both the retail and institutional investor.

For more introductory reading on the forex market, check out Getting Started In Forex and Forex Basics: Setting Up An Account.

by Richard Lee,

Richard Lee is a currency strategist for Online Forex Trading. Employing both fundamental and technical models, Lee has previously been featured on DailyFX.com, Bloomberg, FX Street.com, Yahoo Finance and Trading Markets.com. In analyzing the markets, he draws from an extensive experience trading fixed income and spot currency markets in addition to previous bouts in options, futures and equities.

Read more...

Forex Education

Our Blogger Templates

  © Blogger templates Newspaper III by Ourblogtemplates.com 2008

Back to TOP